How to trade
1. Click on “Markets” tab.
2. Within the list of coin pairings provided in Tokenomy, you can click on any desired pairings to enter the trading interface.
3. Trading interface will display the order book, candlestick chart, BTC/ETH/TEN pairing details, limit/market buy or sell option boxes, open orders and trade history.
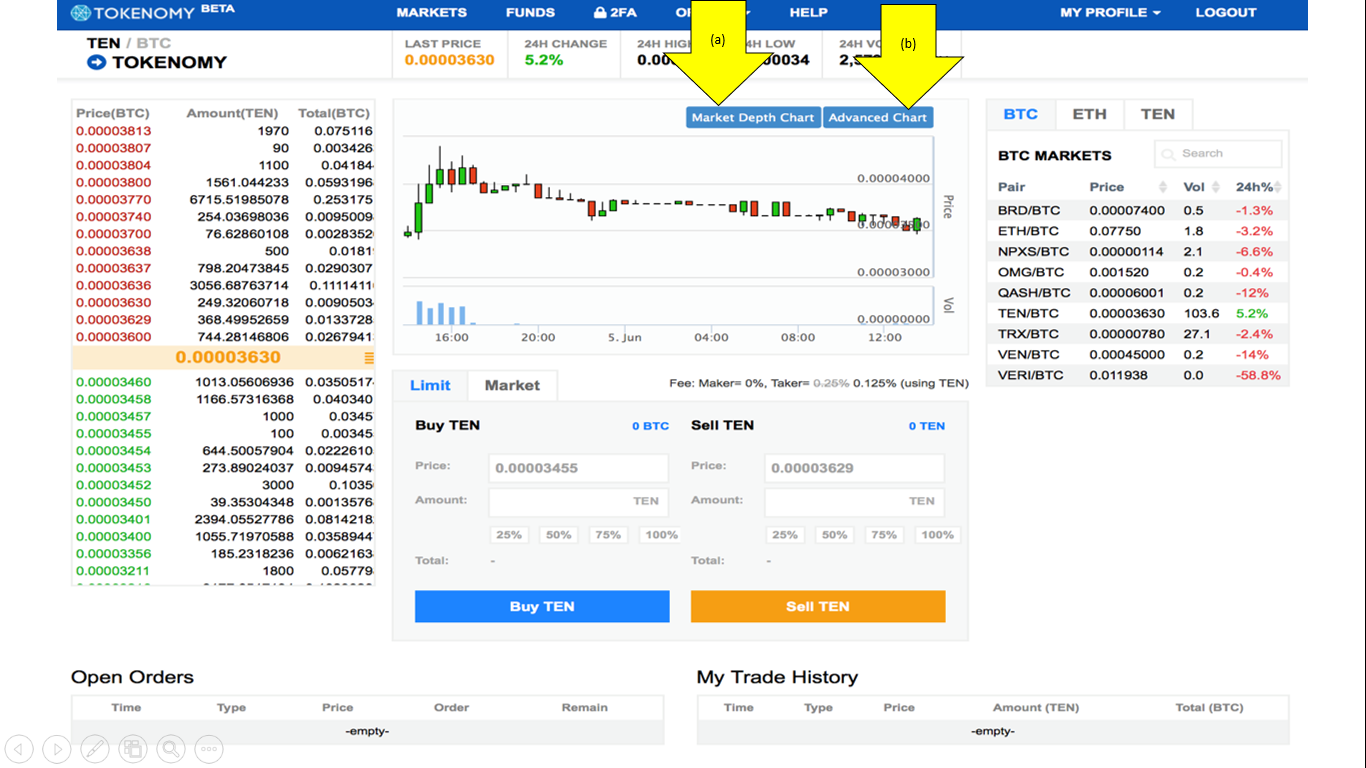
Traders can also access Market Depth Chart and Advanced Chart to help with trading decisions.
(a) Market Depth Chart interface:
With reference to image below, it displays market depth chart for TEN/BTC pair. Y-axis being the total cumulative dollar value of bids or total cumulative dollar value of asks. X-axis is the pairing price. Traders can also mouse-over the interactive market depth chart to view the details at a certain point of the graph.
A list of bid and ask prices are also displayed below the chart for quick reference.
To educate yourself further, please refer to this in-depth article on how to interpret market depth chart and how to use it for your trading decisions,
(b) Advanced Chart:
For traders who wish to assess advanced charting tools, Tokenomy platform provides all of the relevant features such as
- Changing time periods (1m, 5m, 15m, 1h, 1d, 3d, 1w)
- Adding indicators
- Changing chart types (candlestick, hollow candles, bars, line, area, heikin ashi)
- Settings option to change the style, scale, background colour or time zone to suit your preference
WHAT IS LIMIT ORDER
Limit orders allows you to set a maximum purchase price for buy orders, and a minimum sale price for your sell orders. If the market prices for the cryptocurrency pair does not reach your limit price, the order cannot be executed.
WHAT IS MARKET ORDER
Market order allows you to execute your trade immediately at present or market price.
Related Articles
What is the difference between the Main Board and Alternative Board?
Tokenomy is introducing a new layout for our Exchange, with two separate Trading Boards: Main Board and the Alternative Board. Main Board lists the top traded digital assets on the market and on Tokenomy. To qualify to be listed on the Main Board, ...