How to Setup a Temperature Monitoring Project in HardTrack Desktop using Cloud Sensors
Before you begin:
Please follow the instructions
provided to install HardTrack on your PC.
After you have successfully installed HardTrack on your PC, please
follow the provided instructions to Check Now for Updates and Install them In HardTrack, verify that
the correct setting for the database are set in the General Settings
Note: Be sure to click the Activate Database Connection checkbox so that HardTrack Desktop uses the HardTrack Cloud Database.
1) Click Project, New
2) Click Sensors, Add Cloud Sensor(s), Add New Cloud Sensors
3) Click on the Serial Number of the Device that corresponds with the Serial Number/IMEI number found on the device:
4) Click OK, It is not necessary to accept the Update message if one displays. Wake has already updated your devices with all of the settings that are needed to record and upload temperatures to HardTrack. If you click Yes, this is not a problem. The device will just update again, next time it connects to the Cloud:
If you would like to send this command to the device, click Yes:
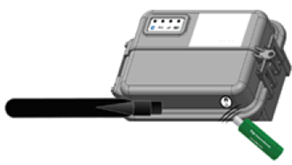
1) Swipe the magnet across the magnet
icon on the Cloud Sensor, the configuration changes will be made when you see
the Blue Flashing Light
Q 1) If I add a device to a new project, will it stop logging
on a past project that active logging is occurring on?
No.
When you attempt to restart logging for a device, you will be
prompted as to whether or not you would like to move the device to the new
project or not. You can move individual
sensors rather than all of the sensors if you desire.
Q 2) What if I receive an error when HardTrack attempt so
send the commands to the device?
Within HardTrack, you should see, after the command was
submitted to provision/update your device, Settings Updated: Submitted Job
5) Click Project Save and give your project a Name:
6) Now Click each of your Sensors and give them a Location Name and Color that matches the Colored tags on the Device, to make it easy to identify the correct location when you are deploying and connecting cable for your concrete pour.
Note: It is important that "(AMB)" remain on the Ambient Sensor in the Device so that HardTrack understands which sensor is being used for Ambient Temperature. If you would rather use one of the sensors with a cable attached for Ambient Temperature, please include "(AMB)" within the Location Name and remove it from the default, internal sensor:
You can delete sensors that you are not going to use for your project, by single clicking on the sensor, then clicking on Sensors, Delete Sensor:
If you make a mistake and delete a sensor now or even later, after the project is logging data, just add the same device back to your project and all sensors that were previously deleted and any temperature data already collected will reappear in your project.
Now Double Click on each Sensor and give it a Color and Location Name. The default Colors for the Sensors, unless you have asked for custom colored tags on the device, are:
Sensor 1 = Yellow
Sensor 2 = Green
Sensor 3 = Blue
Sensor 4 = Red
Click on Sensor Type to Select the Color which matches the Port Tag Color on the device
Click on the ConcreteInfo Tag and Enter the Location Name, then Click Save
Note: The Pour Date & Time can be enter later. There is an option under: Options, Project Duration to set all of the Sensors to the Same Pour Date & Time so that you do not have to enter them individually. If you forget to set the Pour Date & Time, it can be updated at any time.
After you have updated all of the sensors for your project, make sure that you save the project, by clicking Project, Save
 In order to support HardTrack when generating the final report, set the location name of each sensor with these special location names.
7) After double clicking on one of the Sensors, Set the Logging Interval and Upload Interval. These settings will be used by Device for all of the Sensors.
Recommended Setting for your initial test: Logging Interval = 15 Upload Interval = 1
click on Restart Logging. Then Click Ok when you see the message
stating that the Logging Interval will be updated.
Click
Yes
Note: To maintain the longest battery life, it is recommended that you Stop Logging when not using the device on a Project. It is also recommended that you after you see that things are working, Restart logging again with one of the following Recommended Setting:
Logging Interval = 15 Upload Interval = 4
Logging Interval = 30 Upload Interval = 4
Logging Interval = 60 Upload Interval = 3
8) Swipe the magnet across the magnet
icon on the Cloud Sensor, the configuration changes will be made when you see
the Blue Flashing Light
To check on the temperature data that is arriving in your project, click on the Dashboard button at the bottom of the screen:
This will load the HardTrack Dashboard in your internet browser and automatically log you on:
You can hover over data points in the chart to see select information.
Click the Summary button to see the temperature data.
_____________________________________________________________________________________________________
Hardware
Components:
HardTrack
Cloud Sensor has (4) LED’s
As time passes, if you would like to see current temperature information in HardTrack Desktop, click the Project, Refresh:
After Refreshing you project, if you double click on one of the sensors, you will be able to see the last known Battery and Signal Strength:
By clicking on the Temp.Log tab, you will see the latest Temperature information:
If you would like to create an Excel Report of you Project, Click on Project, Export Data and then Project Temperature Reports
You will have several options to include calculated values in the Summary Worksheet of the Workbook and the Summary Chart Worksheet.
Click the Excel Export button to generate your Excel Workbook.
A seperate Worksheet will also be generated for each of the sensors in the project: