Enabling Monitoring
Perform the steps below to enable monitoring for a device, using the interface of your choice, either the CLI or the web.
Using the CLI
- Go to the device’s management settings:
cd /settings/devices/<device_name>/management/ - Configure monitoring for the applicable protocol:
- 1. SNMP:
- 1.1. Version 1:
set snmp=yes snmp_version=v1 snmp_commmunity=<community> monitoring_snmp=yes monitoring_snmp_template=<template_name> monitoring_snmp_interval=<interval_seconds> - 1.2. Version 2:
set snmp=yes snmp_version=v2 snmp_commmunity=<community> monitoring_snmp=yes monitoring_snmp_template=<template_name> monitoring_snmp_interval=<interval_seconds> - 1.3. Version 3:
set snmp=yes snmp_version=v3 snmpv3_username=<user> snmpv3_security_level=<noauthnopriv|authnopriv|authpriv> snmpv3_authentication_algorithm=<md5|sha> snmpv3_authentication_password=<password> snmpv3_privacy_algorithm=<des|aes> snmpv3_privacy_password=<passphrase> monitoring_snmp=yes monitoring_snmp_template=<template_name> monitoring_snmp_interval=<interval_seconds>
- 1.1. Version 1:
- 2. IPMI
- 2.1. Using same credential as access:
set ipmi=yes credential=use_same_as_access monitoring_ipmi=yes monitoring_ipmi_template=<template> monitoring_ipmi_interval=<interval_seconds> - 2.2. Using a different credential for management:
set ipmi=yes credential=use_specific username=<user> password=<password> monitoring_ipmi=yes monitoring_ipmi_template=<template> monitoring_ipmi_interval=<interval_seconds>
- 2.1. Using same credential as access:
- 1. SNMP:
- Save the changes:
commit
Using the Web Interface
1. Click on Managed Devices.
2. Check which devices may support monitoring.
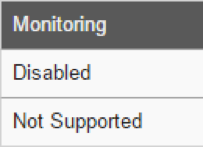
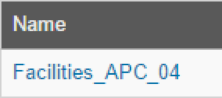
3. Click on the name of a device that supports monitoring.
4. Click on the Management tab.
![]()
5. Enable and configure the protocol.
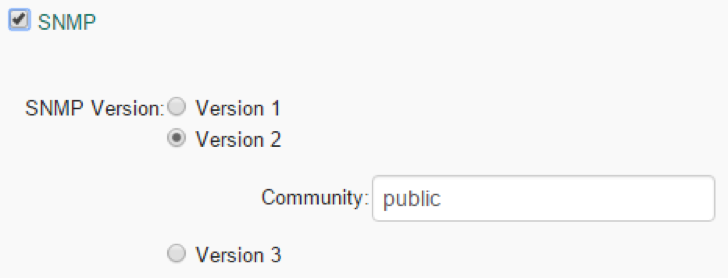
5.1 For SNMP, click on the SNMP checkbox to enable it, select the version, and enter the required SNMP configuration according to the selected version.
For SNMP version 1 or 2, enter the SNMP Community:
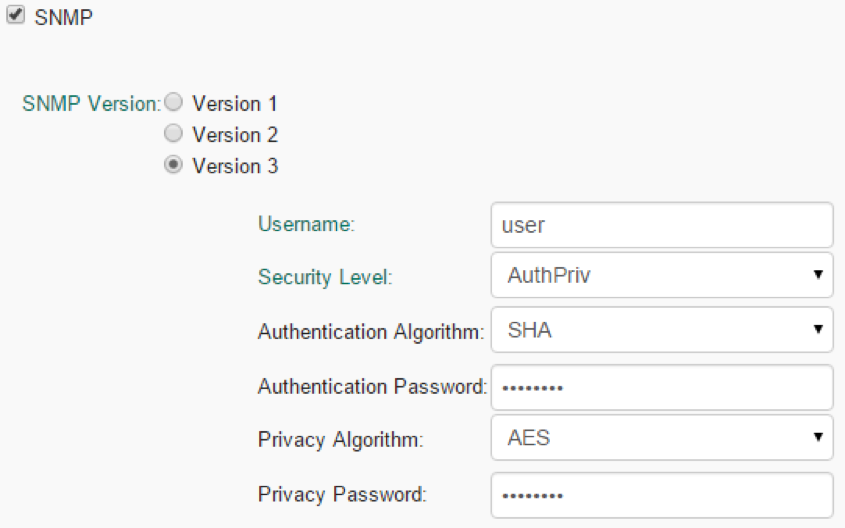
For SNMP version 3, enter username, security level, authentication algorithm and password, privacy algorithm and password:
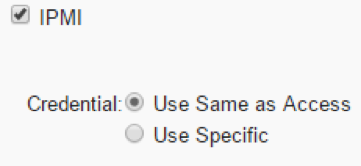
5.2 For IPMI, choose between using the same credentials used for access:
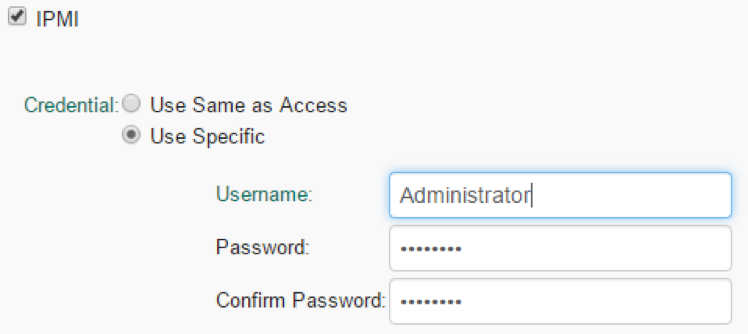
or if you want to a different credential for management and monitoring:
6. Enable monitoring for the applicable protocol.
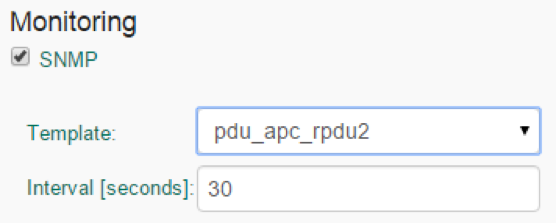
6.1 For SNMP, click on the checkbox under monitoring to enable it, select a template, and configure the collection interval.
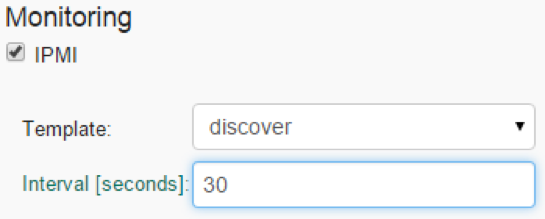
6.2 For IPMI, click on the checkbox under monitoring to enable it, select a template and configure the collection interval
7. Click on Save.

Related Articles
NodeGrid Monitoring Aggregation Settings
Here is how to configure a monitoring aggregation. 1) Make sure you have a monitoring license installed. If you don't have one, add one via System > License 2) Make sure you have the devices you want to aggregate configured and monitoring is enabled. ...Customizing a Monitoring Template
There are a number of pre-existing monitoring templates, and if any of them satisfies your needs you can skip to the next section. All templates are text files located under the directories /etc/collectd.templates/snmp /etc/collectd.templates/ipmi ...How to: Add OpenSearch Temperature visualization to Nodegrid
The Dashboard (WebUI only) allows visual presentations of Event activities, Managed Device details, and data monitoring. Multiple dashboards can be created for different purposes. For example, one to monitor managed device data points (i.e., Power ...Exploring Data Points
This section will describe how you can verify that we are actually persisting the data collected and to learn more about the data being collected. This knowledge will be helpful in the Creating a Visualization article. First, make sure that you have ...Steps to create a monitoring dashboard of a PDU
Please, follow the instructions of the following articles, in this order: 1. Enabling Monitoring 2. Exploring Data Points 3. Creating a Visualization 4. Creating a Dashboard 5. Inspecting a Dashboard 6. NodeGrid Monitoring Aggregation Settings 7. ...